
AI Usage
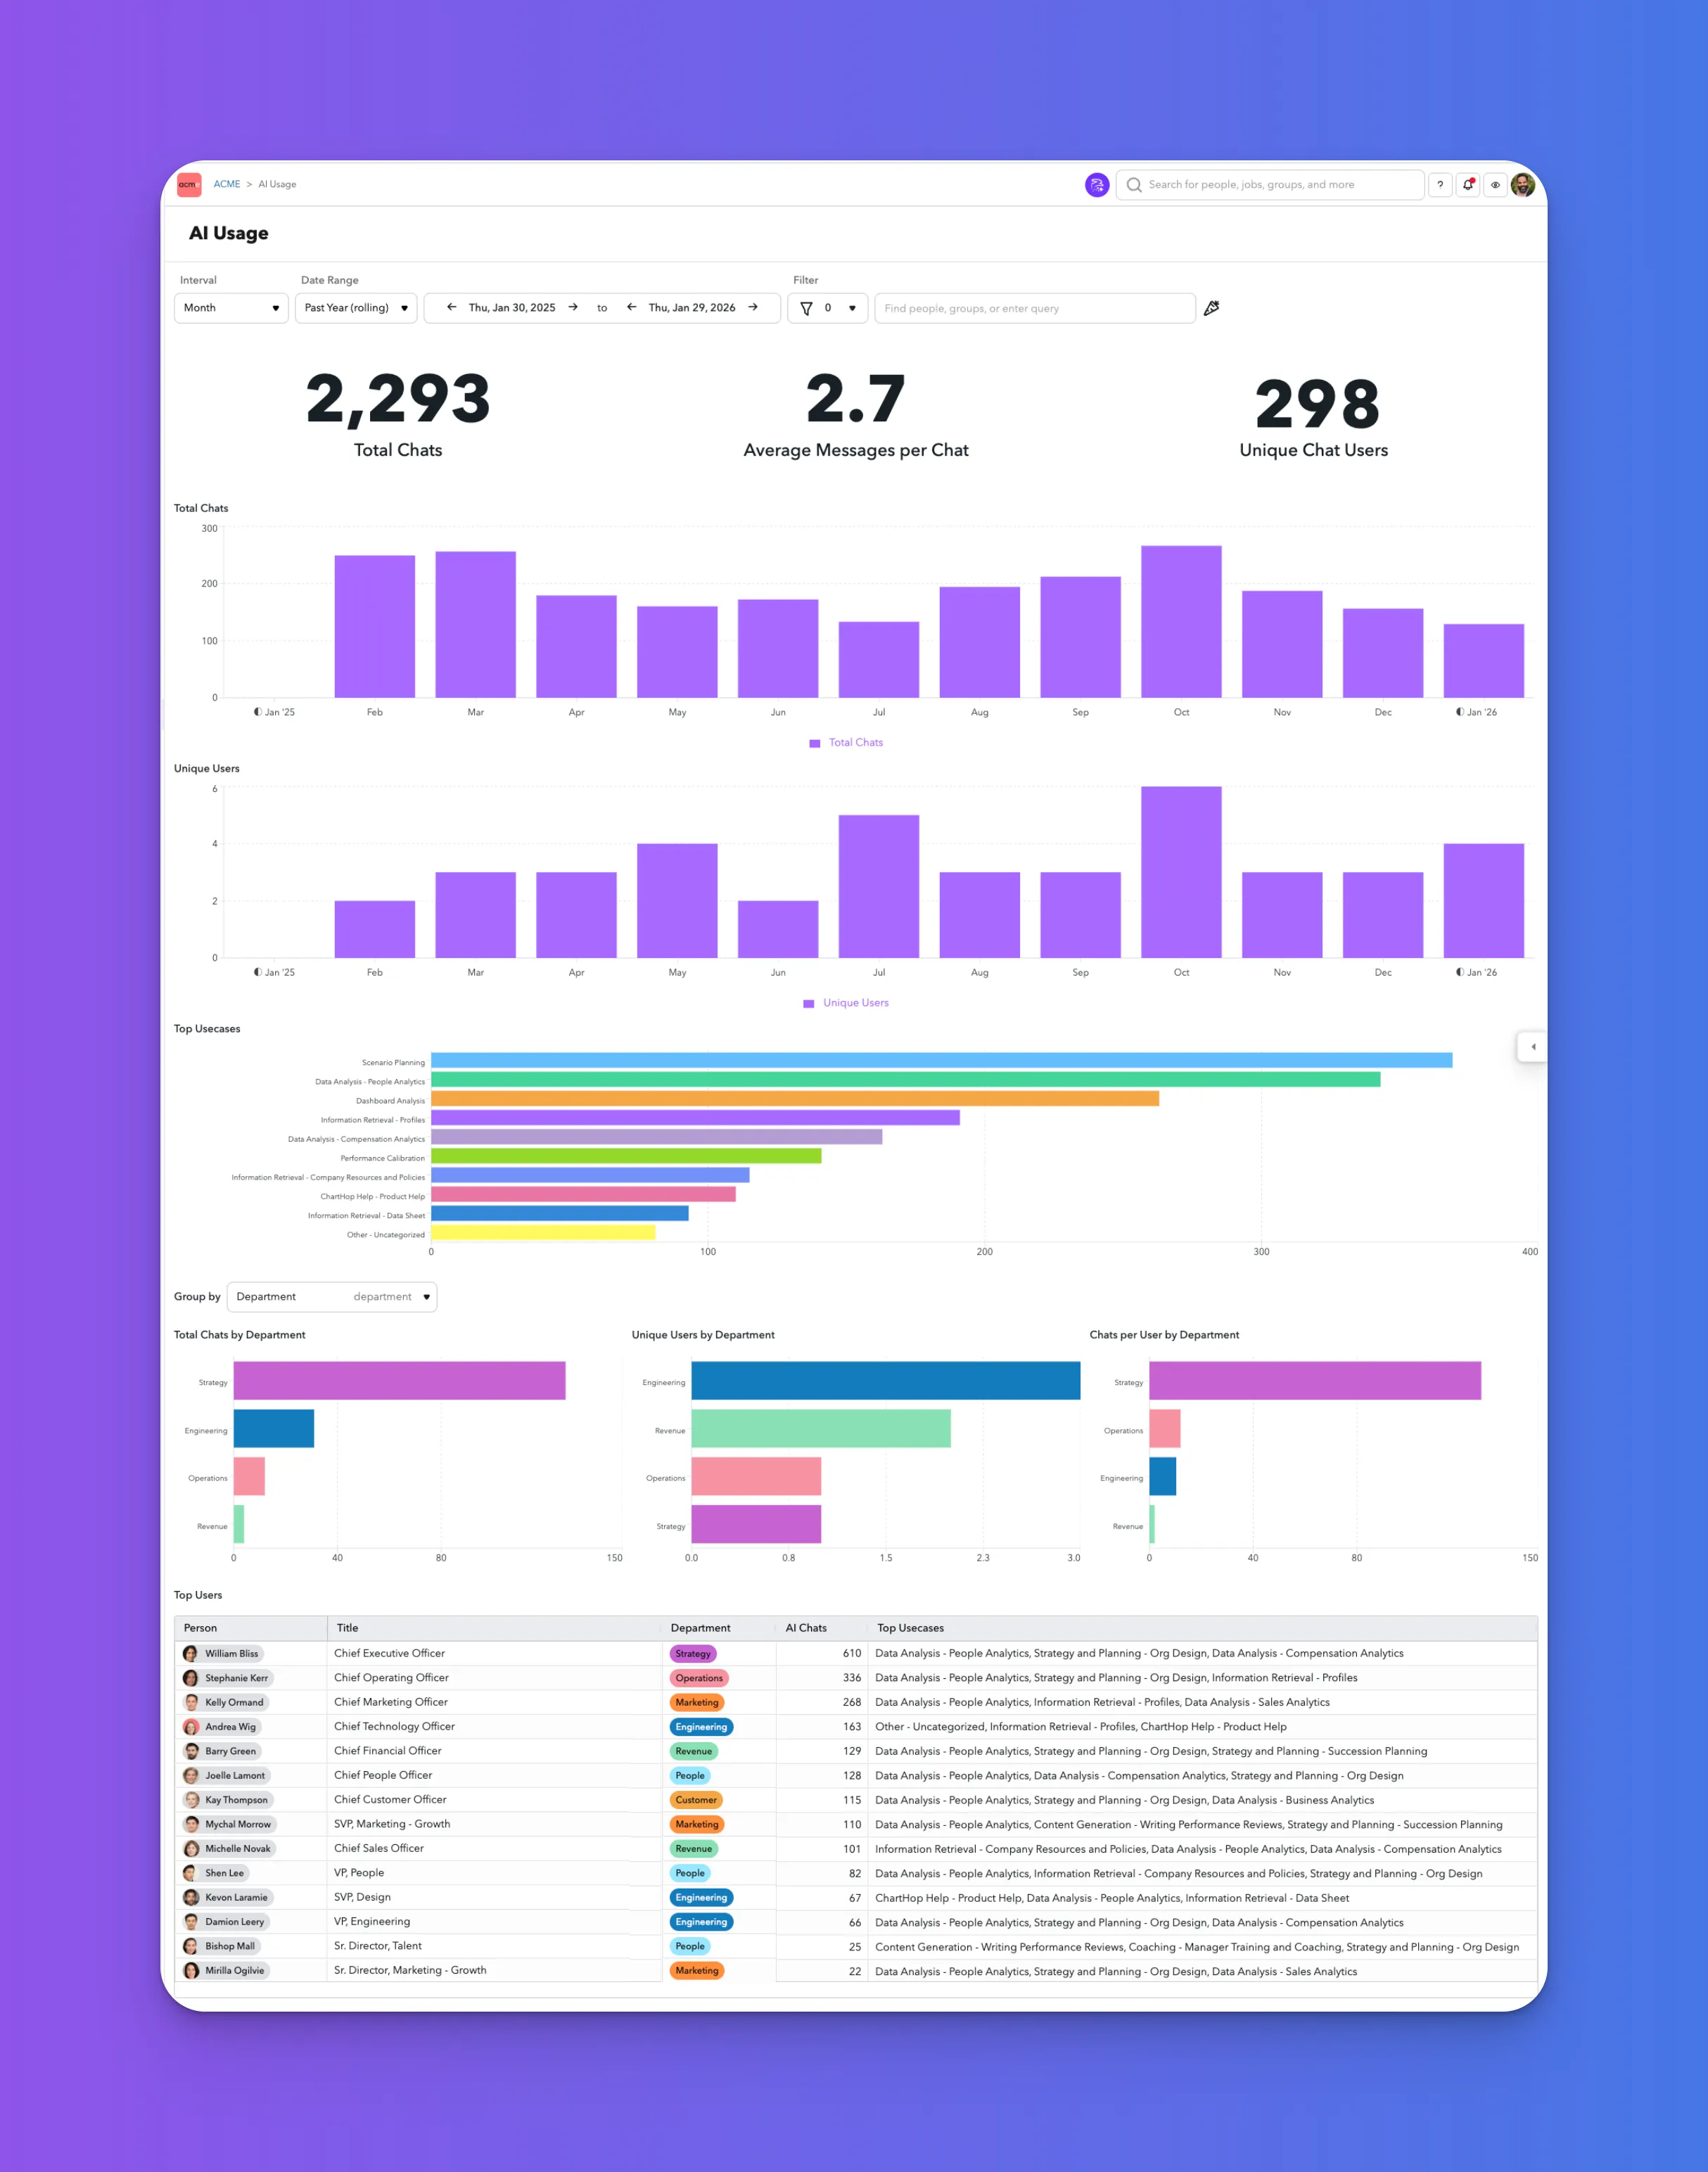
The AI Usage view provides administrators with visibility into how AI features are being used across their ChartHop account. Use this dashboard to understand adoption, monitor usage trends over time, and identify where AI is providing the most value across teams and individuals.
You can find this view at Admin > History > AI Usage.
What you can do
From the AI Usage dashboard, you can:
- Track overall AI activity across your organization
- See how many people are using AI features
- Understand which AI use cases are most common
- Compare usage across departments
- Review AI usage (generalized) by individual users
This view is read-only and intended for auditing, monitoring, and analysis.
Date range and filters
At the top of the page, you can adjust the scope of the data shown:
- Interval: View usage aggregated by month (or other available intervals).
- Date range: Select a predefined range (for example, past year rolling) or a custom start and end date.
- Filter: Narrow results by people, groups, or other supported filters.
All charts and tables on the page update based on your selected filters.
Summary metrics
The top of the dashboard highlights three key metrics for the selected time range:
- Total chats: The total number of AI chat sessions initiated.
- Average messages per chat: The average number of messages exchanged within each chat session.
- Unique chat users: The number of distinct users who interacted with AI features.
Use these metrics to quickly gauge overall adoption and engagement.
Usage over time
Total chats
The Total Chats chart shows how AI chat volume changes over time. This helps identify trends such as increasing adoption, seasonal spikes, or periods of lower usage.
Unique users
The Unique Users chart displays how many distinct users engaged with AI during each interval. This is useful for understanding whether usage growth is coming from more users or heavier usage by the same users.
Top use cases
The Top Usecases section ranks the most common ways AI is being used, such as:
- Scenario planning
- People analytics
- Dashboard analysis
- Information retrieval (for example, profiles, policies, or data sheets)
Use this view to understand which workflows are benefiting most from AI and where additional enablement or guidance may be helpful.
Usage by group
You can group AI usage by organizational attributes, such as Department, Location, Teams, or any Field.
When grouped, the dashboard shows:
- Total chats by group: Which teams generate the most AI activity.
- Unique users by group: How many people in each group are using AI.
- Chats per user by group: Average intensity of AI usage per user within each group.
These comparisons can help identify differences in adoption across teams.
Top users
The Top Users table lists individuals with the highest AI usage during the selected period. For each user, you can see:
- Name and title
- Department
- Number of AI chats
- Most common AI use cases
This table is useful for identifying power users, champions, or teams that may be early adopters of AI features.
Privacy and data visibility
The AI Usage dashboard is designed to provide transparency into AI adoption while protecting individual privacy and sensitive information.
- The dashboard does not display the exact prompts, questions, or messages that users submit to AI features.
- Administrators cannot view the full content of individual AI conversations.
- Usage is summarized and categorized to show the nature of the use case (for example, scenario planning, analytics, or information retrieval) without exposing specific inputs or outputs.
This approach helps organizations understand how AI is being used while maintaining appropriate privacy boundaries for employees.
Notes and limitations
- The AI Usage dashboard reflects activity within ChartHop’s AI-powered features only.
- Metrics are aggregated and intended for usage monitoring, not performance evaluation.
- Availability of filters and group-by options depends on your account configuration.