Tables
This feature is currently in Alpha. Be one of the first customers to try it! Please share any feedback with the ChartHop team.
How to setup a Alpha Feature
- Read below for setup instructions and context on how the feature will work.
Overview
Business Tables let you store and manage custom structured data in ChartHop — independent of employee or job records. Common use cases include tracking sales targets, headcount plans, cost centers, events, or any org-specific dataset.
Places to utilize data from Tables
- Home Page
- Profile Tabs
- Dashboards
- Forms (Text blocks)
- Resource Pages
- Letter Templates
Tables access
Initially only Owners have the ability to create Tables.
Tables utilize ChartHop's share access , so anyone in the organization can be given access to table to edit or view a specific table.
Creating a Table
1 Navigate to Tables in the left navigation.
2 Click the Create button in the top right corner.
3 In the Create Table dialog, fill in:
- Code name — A programmatic identifier used in formulas and the API (e.g., salesTargets). No spaces; use camelCase.
- Display name — The human-readable name shown in the UI (e.g., Sales Targets).
4 Click Save. The table is created and opens to an empty state.
The table list shows all tables with their display name, code name, row count, creator, last modifier, creation date, last modified date, and who it's shared with. Use the Filter by name search to find tables quickly.
Creating Columns
A new table starts empty. You must define at least one column before adding or importing data.
- From the empty table view, click Create column.
- Fill in the Create column form:
Field | Description |
|---|---|
Label | The display name for the column header. |
Field code | The programmatic identifier used in formulas and the API. |
Description | Optional. Explains what this column stores. |
Category | Groups the column for organizational purposes. Defaults to Uncategorized. |
Sensitivity | Controls visibility. Org Public = visible to everyone in the org; not shared outside. |
Data type | The type of value stored (e.g., Short text, Number, Date, Currency). See data types below. |
Unique | Marks this column as the unique identifier for each row. Required on the first column. |
Track changes over time | Enables historical tracking for this column's values. |
Expire after | Optional. Number of days after which a row's value in this column expires. |
- Click Save. Repeat to add additional columns.
Important: The first column of every table must have Unique checked. This column acts as the primary key — each row must have a distinct value in this field. This is required for data imports and row matching to work correctly.
Column Data Types
Business Table columns support the same data types as ChartHop fields, but are not tied to employee or job records. Available types include:
- Short text
- Long text
- Number
- Currency (money)
- Percent
- Date
- Boolean
- Enum (single or multi-select)
Importing Data from a Spreadsheet
Once your columns are defined, you can populate the table by importing a CSV or spreadsheet file.
1 Open the table you want to populate.
2 Click the download/import icon in the top right of the table view to open the export/import menu.
3 Select Import table from spreadsheet.
4 Upload your file. Column headers in the spreadsheet should match the field codes or labels of your table columns.
5 Review and confirm the import mapping, then complete the import.
Tips for a clean import:
- Ensure your spreadsheet has a column matching the unique column — this is how ChartHop identifies and deduplicates rows.
- Column headers should match your table's field codes exactly (case-sensitive).
- Remove any summary rows, merged cells, or extra header rows before importing.
Other Import/Export Options
Option | Description |
|---|---|
Export to CSV | Downloads the current table data as a CSV file. |
Sync to Excel/Sheets | Syncs the table to a connected Excel or Google Sheets document. |
Import table from spreadsheet | Uploads a spreadsheet file to populate or update the table. |
Sync from business data | Sync from Zendesk, Google Sheets, Salesforce and more! |
Maintaining a Table
Editing Table Structure
- Click the pencil (edit) icon in the top right of the table to edit table settings or column definitions.
- Add new columns at any time using the Create column button.
- Column data types and unique settings can be modified after creation, but changing the unique column may affect existing row matching.
Editing Data
- Rows can be edited inline directly in the table view.
- Use Import table from spreadsheet to bulk-update rows — rows matching on the unique column will be updated; new rows will be added.
- Use Export to CSV to pull data, edit it externally, and re-import.
Filtering and Finding Tables
- From the Tables list, use the Filter by name search bar to find tables by display name.
- Tables are sorted by display name by default. Click any column header to re-sort.
Sharing Access
The Shared with column on the Tables list shows which users or groups currently have access to each table.
To share a table:
- Open the table.
- Click the share/link icon or access sharing settings via the table edit menu.
- Add users or groups who should have access.
Column-level sensitivity settings also control visibility. A column set to Org Public is visible to all org members with table access, but is not shared outside the organization. Adjust sensitivity per column if certain fields (e.g., salary bands) should be restricted to specific roles.
Examples of how data from tables are used
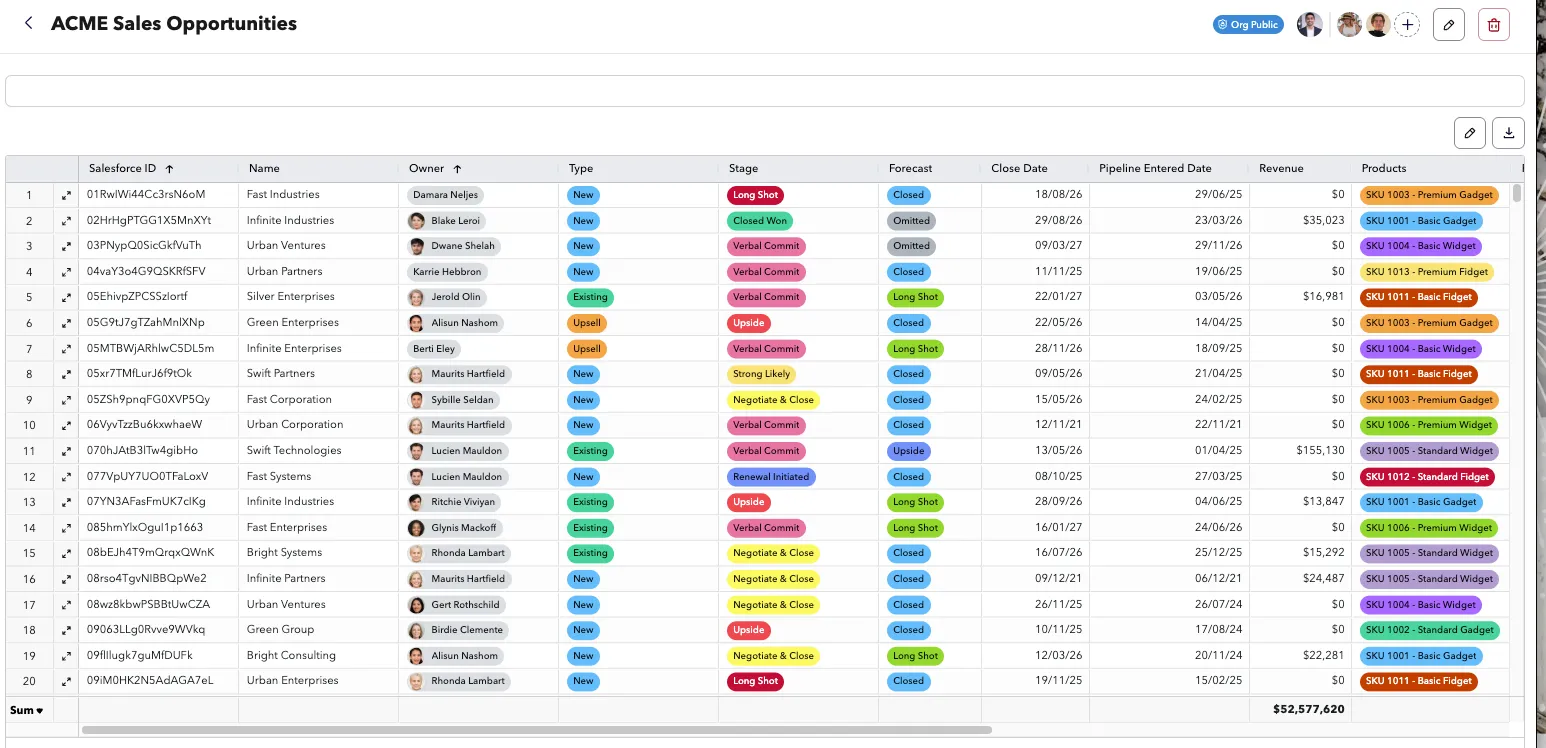
Example Salesforce data in a table
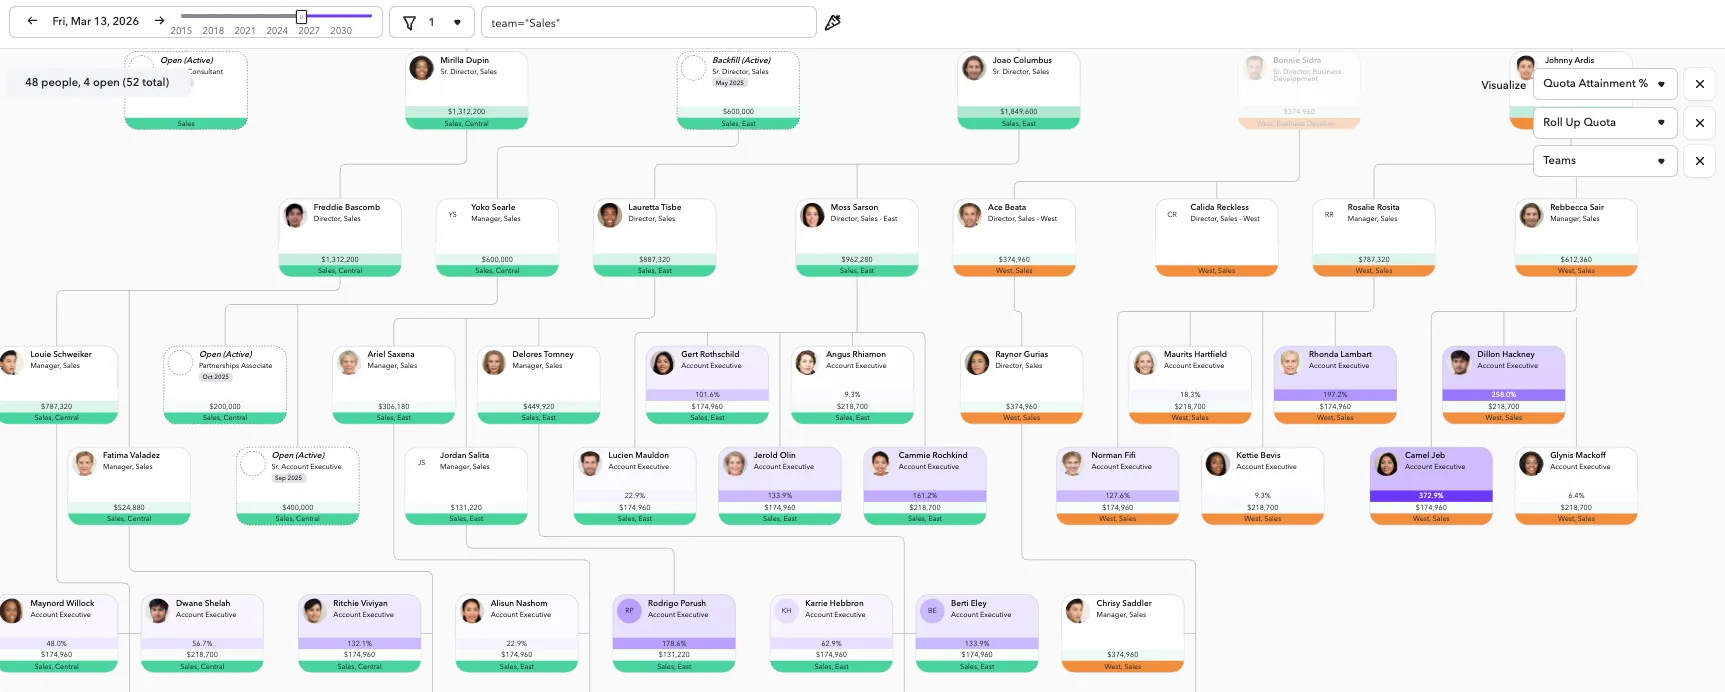
Once data is in a table in ChartHop, it can be referenced throughout the platform, like in the org chart:
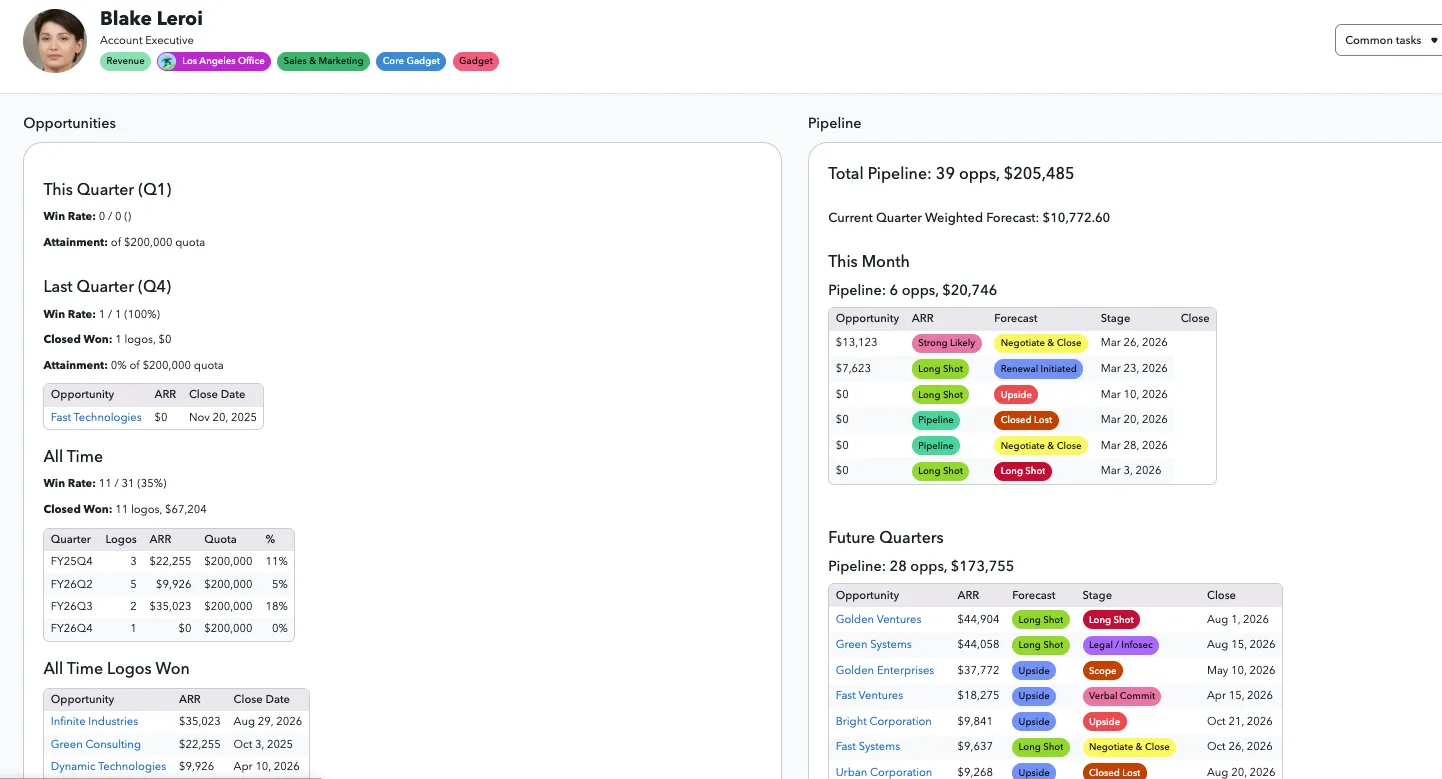
Or in profile tabs:
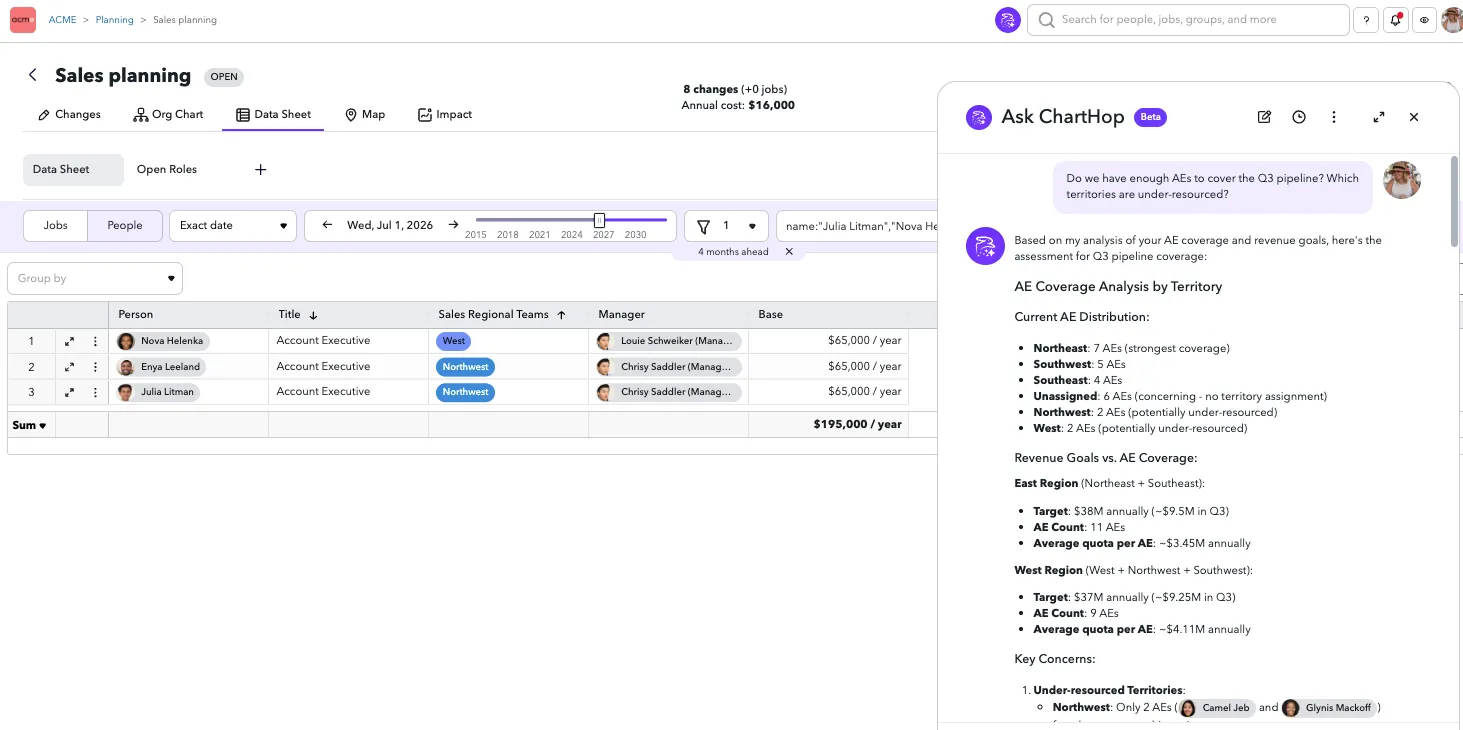
ChartHop is more powerful with more data is has access to- leveraging AI can help you make decisions faster. With Salesforce and Zendesk data paired with people data, Charthop AI can help you make a scenario to forecast new headcount based on pipeline growth proactively- and THAT is the power of data.