
Data Sheet
The Data Sheet provides a list view of your organization, which is helpful when you need to customize how you see your organization's data or edit the data for multiple employees at once.
You can use the Data Sheet as a source of truth for all the job and people data within your organization. This page gives you the ability to create a customized view of your data for all of your planning needs. You can control what data displays on the page by customizing the columns you need and sorting by a particular column. You can also use filters to refine which employees and jobs are included in the list.
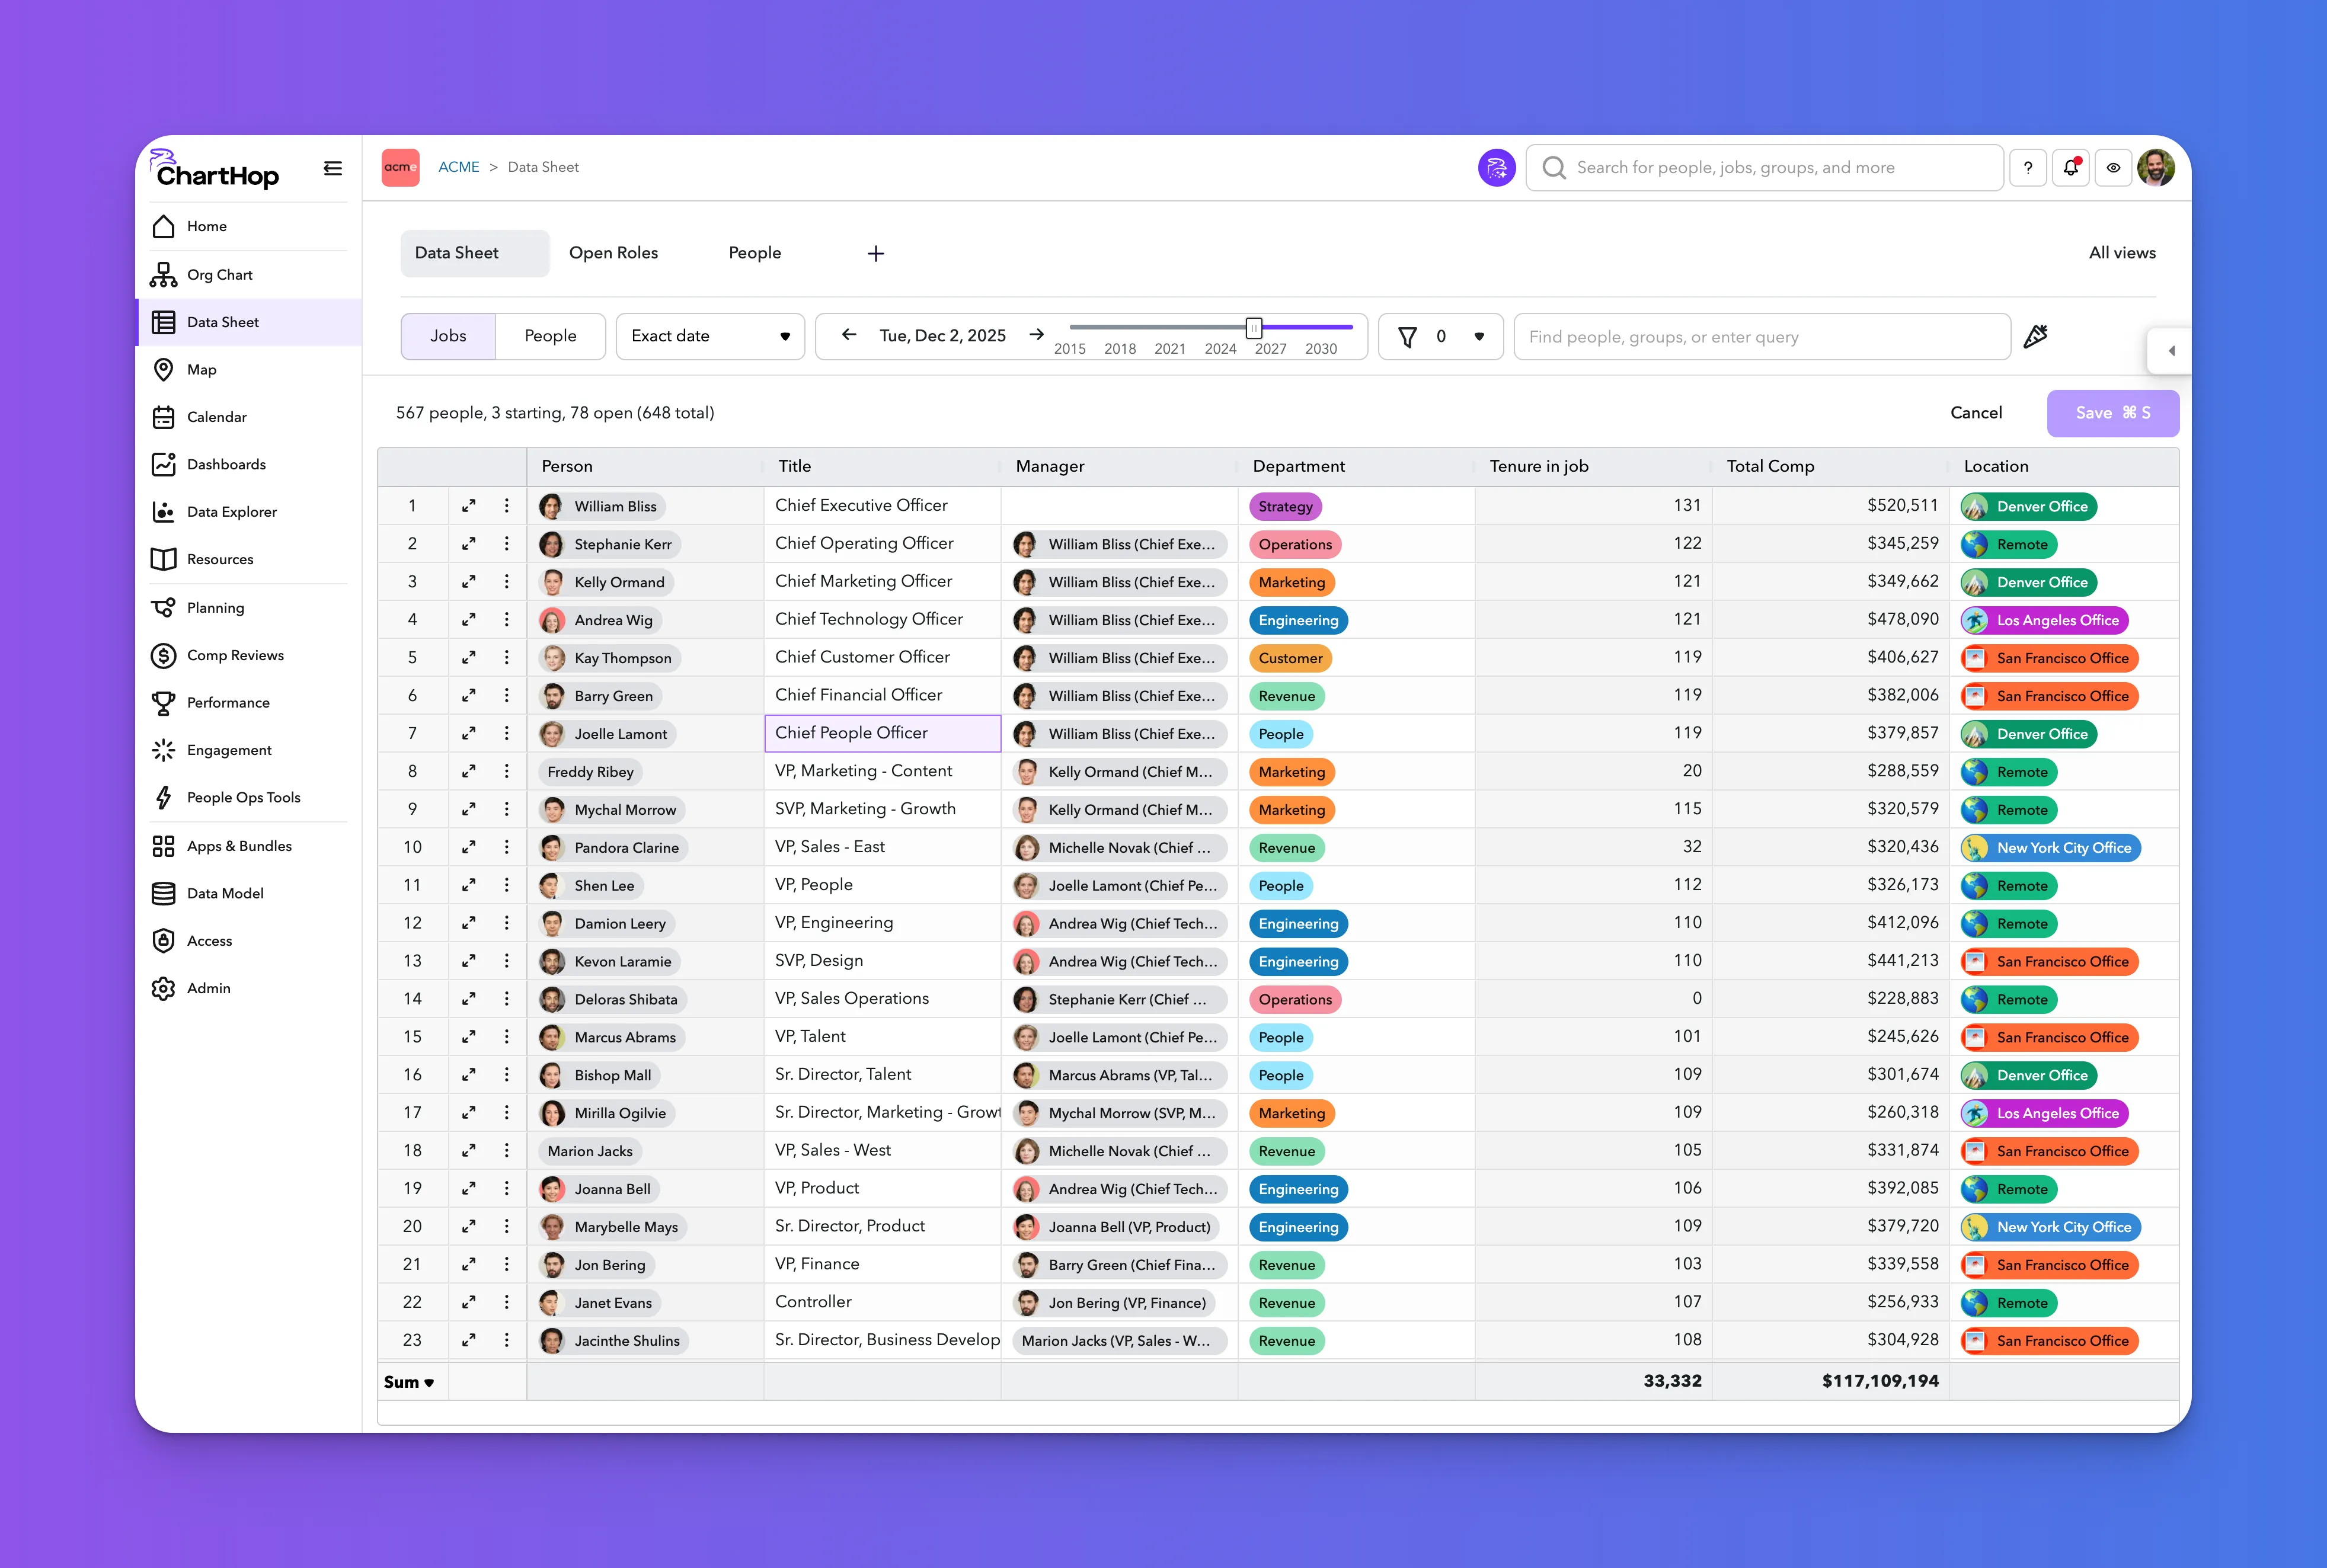
Navigating the Data Sheet
When you start viewing the data sheet you are in the unsaved "Data Sheet" view. As you Add ColumnsAdd Columns , Data SheetSorts, Data SheetFilters, you will create the exact view of the data that you need. You
Data is protected at the field (column) level by the Controlling sensitive datasensitivity level assigned to the field, the viewer's positition in the organization and by their specific Key Concepts: Role-based Accessuser access role.
Most data in ChartHop time tracked. So you will see a time selection and slider at the top of the data sheet. This will show you what date you are viewing the data as of.
Actions
Above the Data Sheet on the right side, you will see a row of icons. These options are:
- Restore / ResetRestore / Reset (Circular arrow icon)
- Edit Mode (Pencil Icon) - Only shown if you can edit data.
- Select & Manage Columns (Column Icon)
- Add Open Job (Plus Icon) - Only shown if you have access to do this.
- Export and Sync (Download Icon)
- Copy all data & headers
- Export to CSV
- Sync to Excel/Sheets

Filtering data
Refine what Jobs or people are displayed by applying a filter to the data.
More information about filtering can be found in Filtering dataFiltering data.
Columns
Adding & Removing Columns
You can quickly add a new column by clicking the ➕ in the last column header or any column header.
Click the column header to and click "Hide column" to remove it from the data sheet view.
You can also use the Select Columns button located above the data sheet and dialog to add, remove and reorder columns as well.
To retain the columns that you added to to the data sheet, Data Sheetsave the data sheet view - give it a name and share it with others.
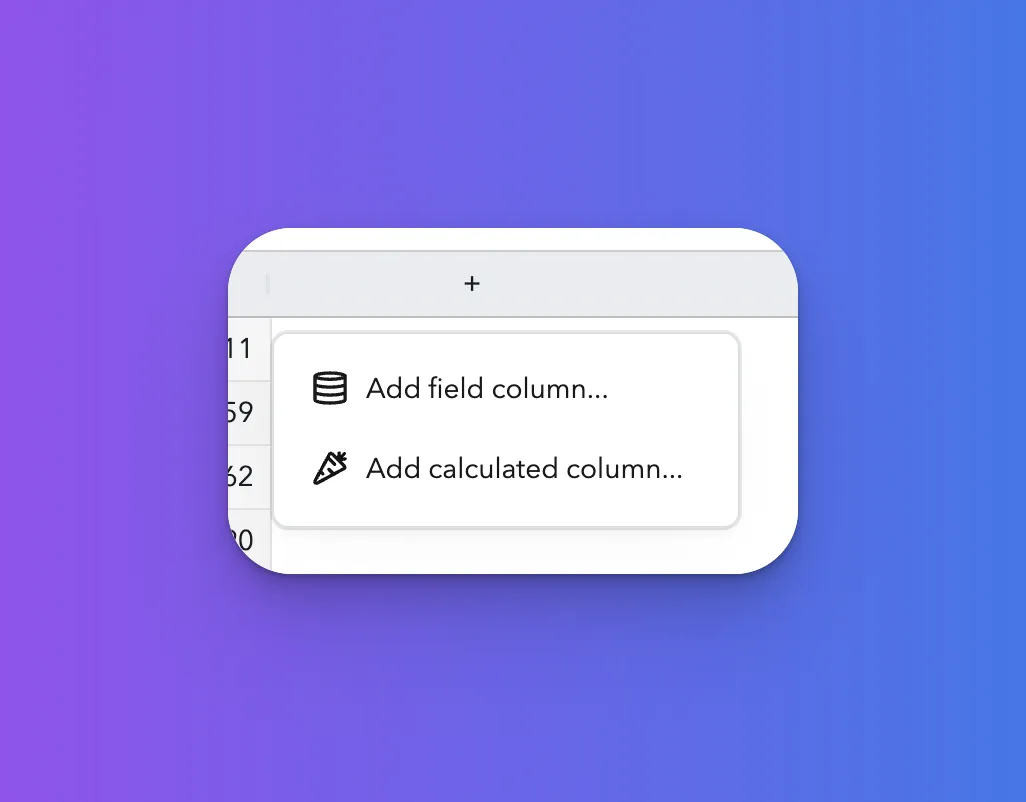
Calculated columns
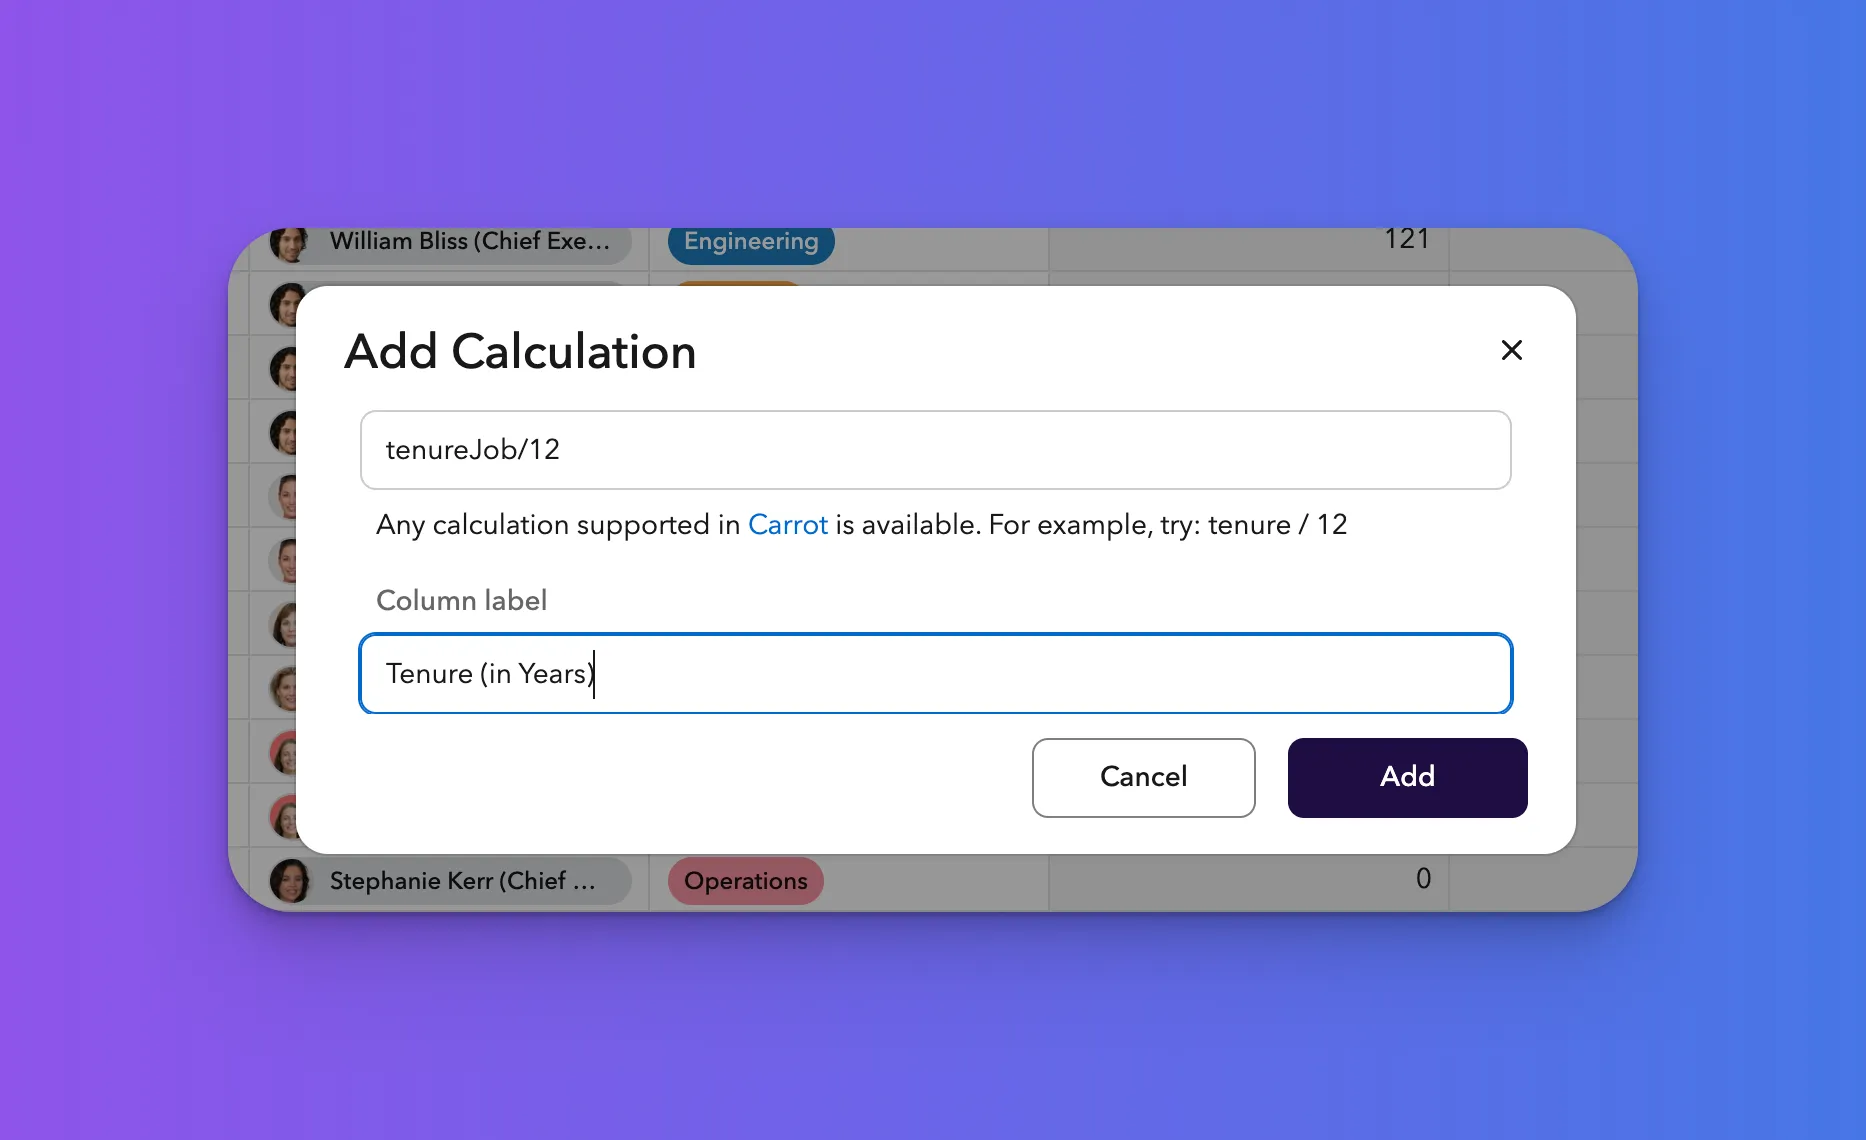
Calculated columns are like a Formula in a spreadsheet that is applied to the whole column. You can add any calculation to your sheet by:
- Click the "+" Column
- Click Add calcualted column
- Add the formula and a column label.
This column can be saved as a Field data types & smart fieldssmart calculation field or can just exist within the context of the sheet.
Sorting Columns
Click the column header then select "Sort ascending" or "Sort descending" to sort a column.

Column Details
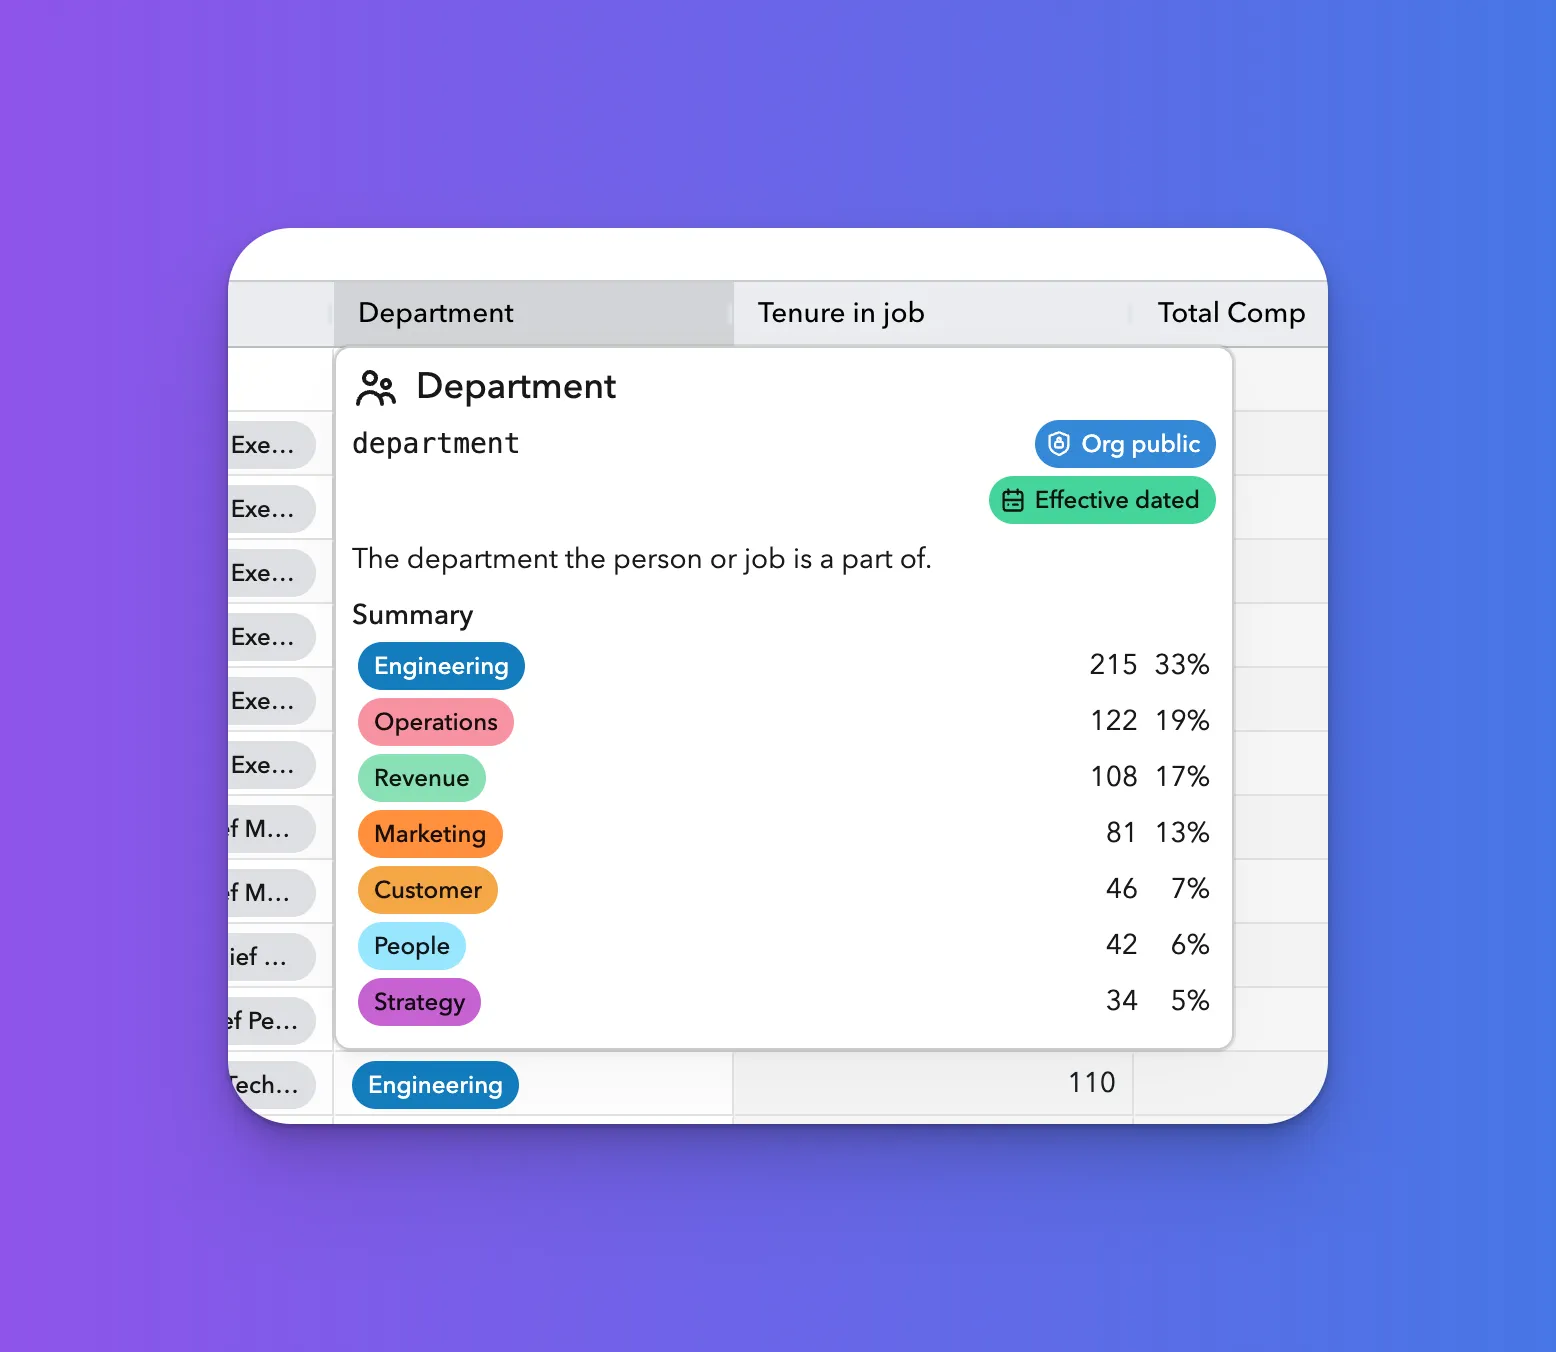
Hover over a header to view information about the field in the colum including:
- Type (icon)
- Name
- Field code
- Sensitivity
- Description
- Summary with a breakdown of percentages for certain types of fields.
Data Views

Saving a Data Sheet View
To save a Data Sheet view (Columns, filters and time selection):
- Rollover the "Data Sheet" tab at the top of the Data Sheet
- Select Save as new view
- Give the view a name
- Share the view with others.
Using Relative Dates in Saved Views
When you save a Data Sheet view, the filter is saved as written — not as a snapshot of the evaluated date. This means filters that use relative date expressions will stay dynamic and automatically recalculate each time the view is opened.
For example, to create a saved view that always shows people who started in the last 30 days:
startDateOrg >= date('-30d') and is:personOr to find people approaching a 90-day milestone (started between 85 and 95 days ago):
startDateOrg >= date('-95d') and startDateOrg <= date('-85d') and is:personBecause the filter stores date('-30d') rather than a hardcoded date like 2026-04-15, each time someone opens the saved view, the date range is recalculated from the current date.
The date slider is also saved. If you want the view to always reflect today's data (not a historical snapshot), set the date slider to Today before saving the view.
Restore the Data Sheet
The home "Data sheet" can be reset to clear all columns, filters, and dates back to the default. Normally they are retained from session to session across time.
Taking action on a Person or Job
There are various ways to edit data on the data sheet. You can use the Action MenuAction Menu, copy & paste within the data sheet, copy & paste from a spreadsheet, bulk edit
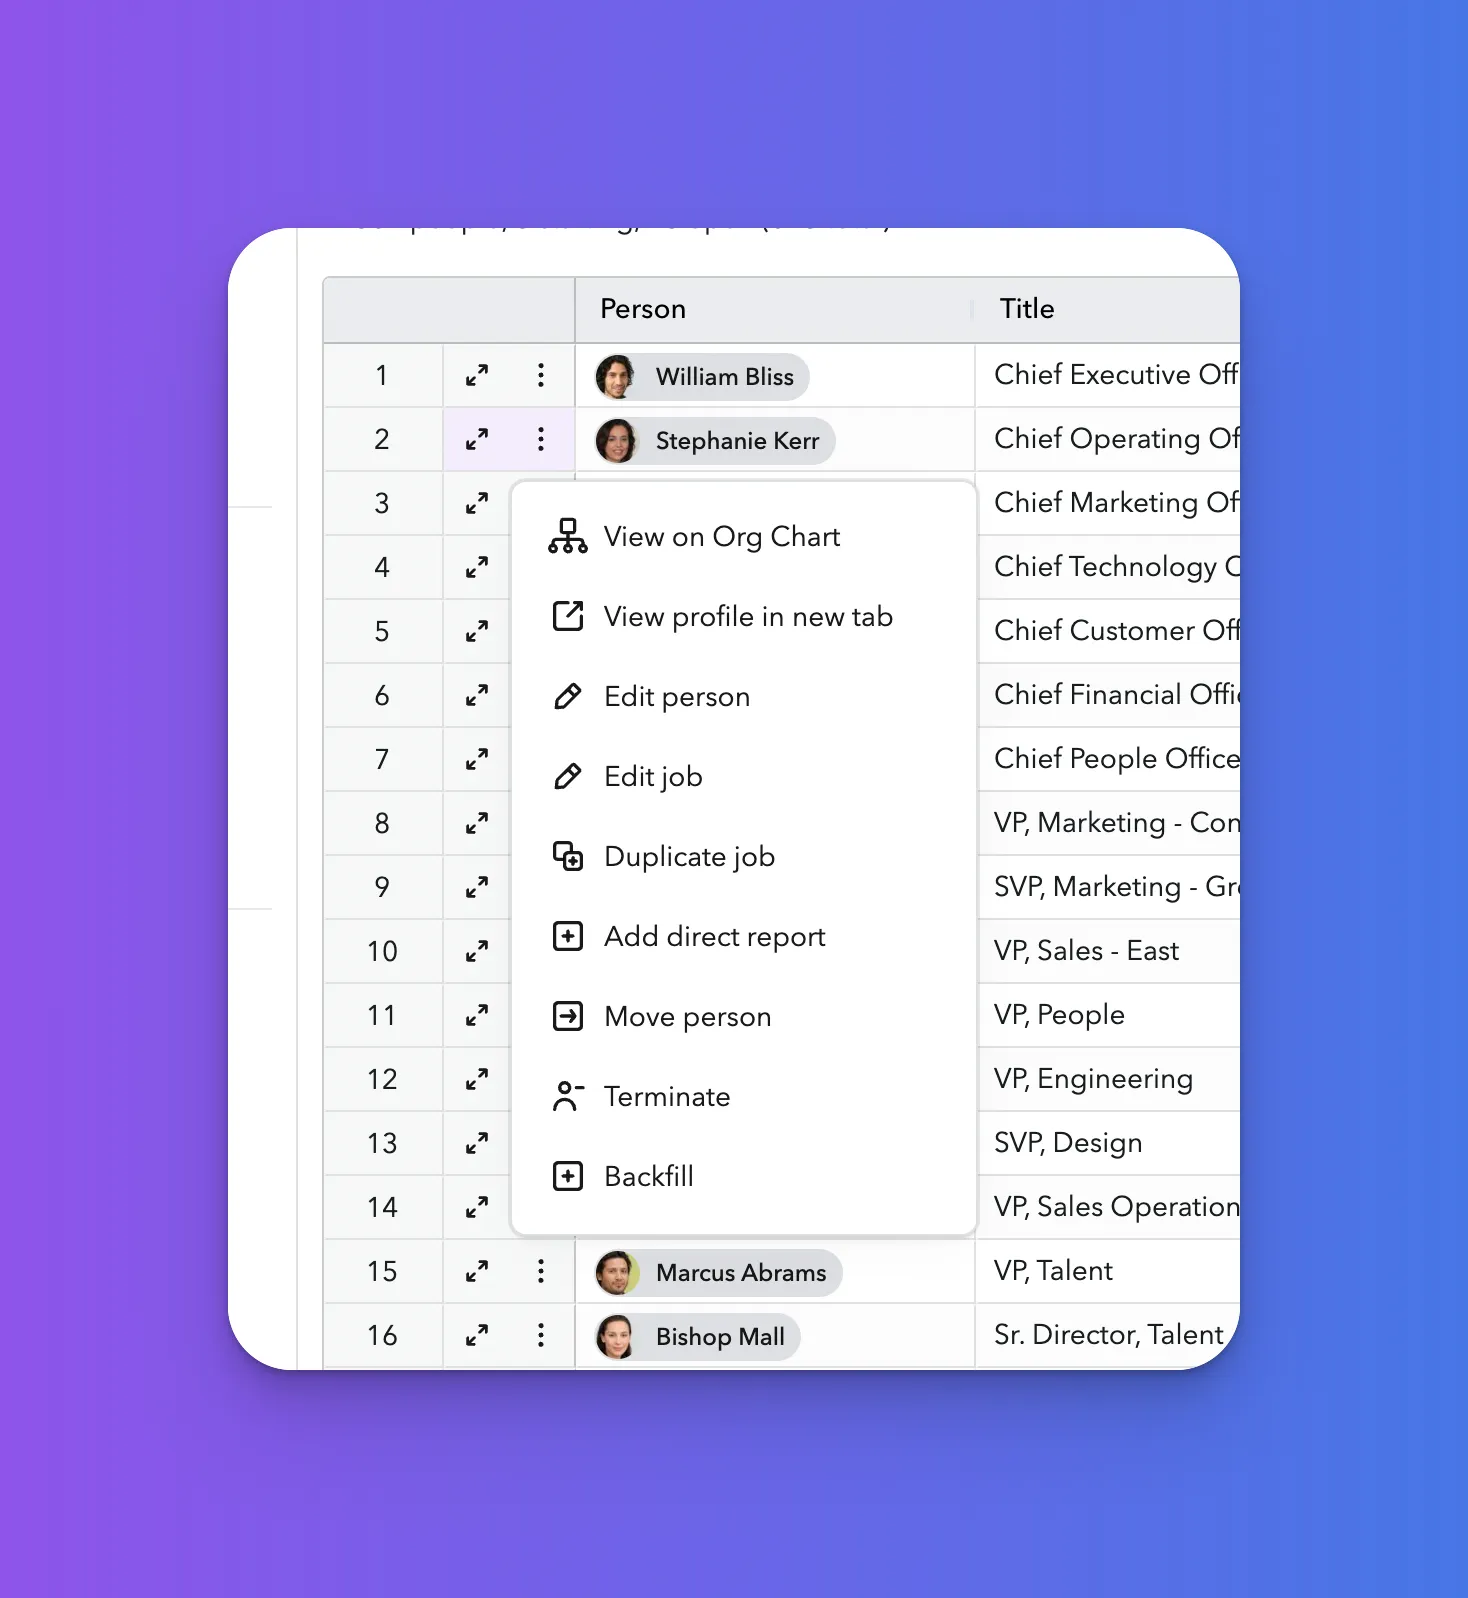
Action Menu
To access the actions like Edit job, Edit person or Terminate, you can either:
- Click on the action button (button with three dots)
- Right click on the row
- Click on the expand button (button with diagnal opposing arrows) and select actions from the buttons on the side panel
The Editing employee profilesEdit Person or Edit jobsEdit Job will allow you to pull up a dialog for you to edit from.
Edit a cell
To edit a cell in the Data Sheet, either:
- Double Click on a Cell you wish to Edit
- Click the Edit Button (Pencil Icon) in the top right
Once you are done making Edits, Click Save and Review Changes.
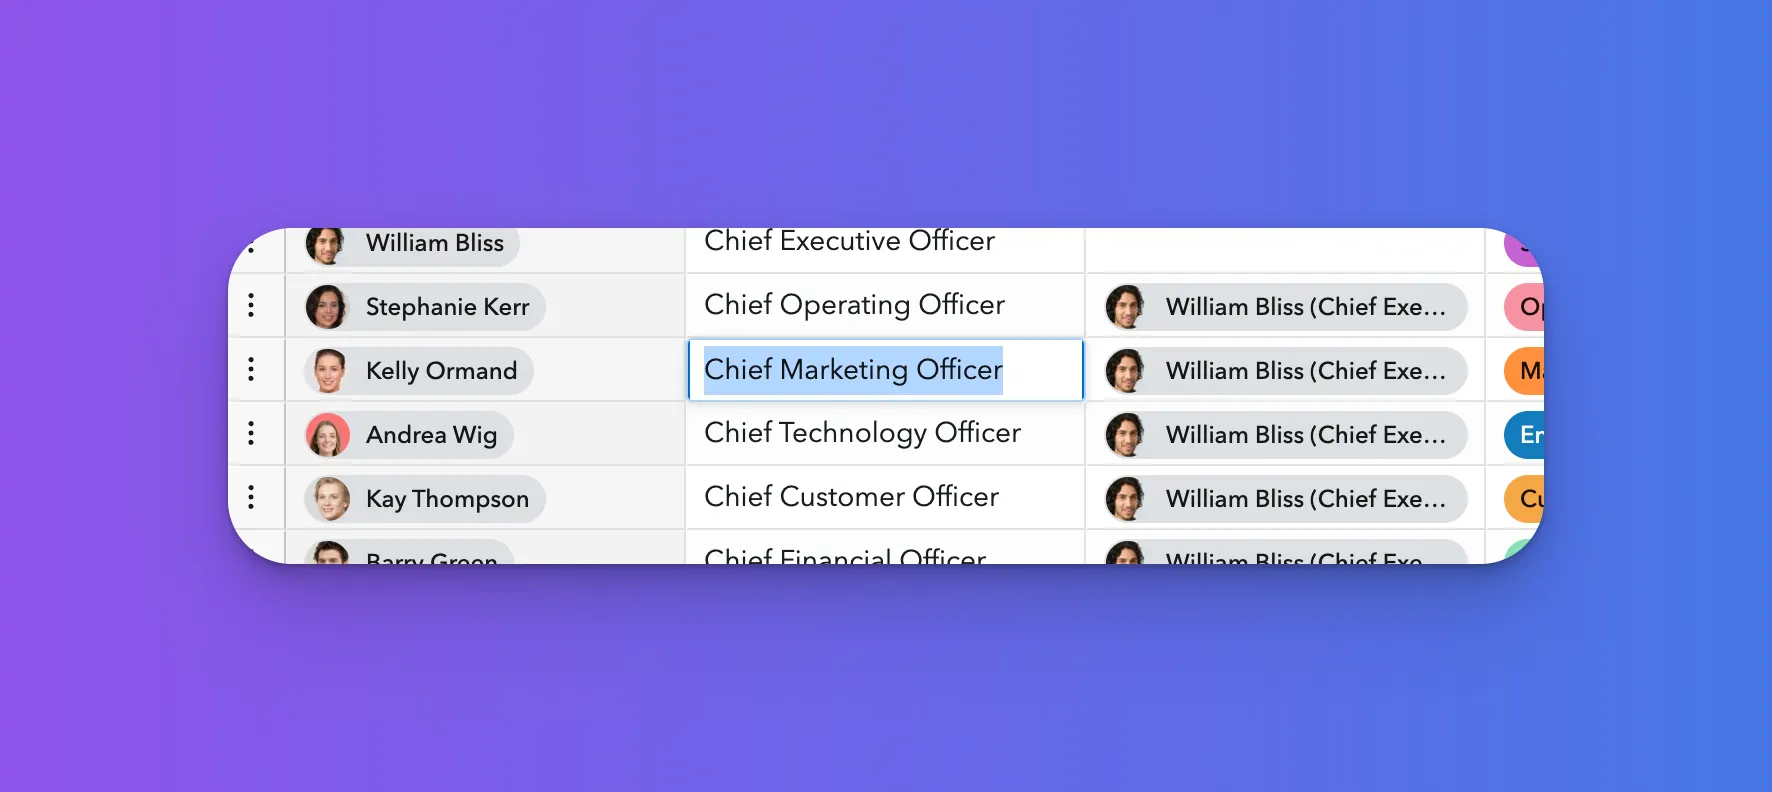
Copy + Paste
Copy & Paste within ChartHop — Select then copy any cell or cells, paste it onto other data that you have access to edit and the changes will be staged.
Paste into ChartHop — Copy data from another spreadsheet then paste it into the data sheet. If the cells are editable for you and the values are valid, it will paste in. Then you can adjust or save the changes.
Copy from ChartHop — Select then copy any content, paste it onto a spreadsheet like Excel or Google Sheets. ✨ Magic.
Copy entire data sheet — To copy all of the data and headers, use the Export menu at the top right of the data sheet and select Copy all data & headers
Bulk Edit
To edit more than One Person or Job at a time, select multiple rows and Right Click on the selected rows and select Bulk Edit.
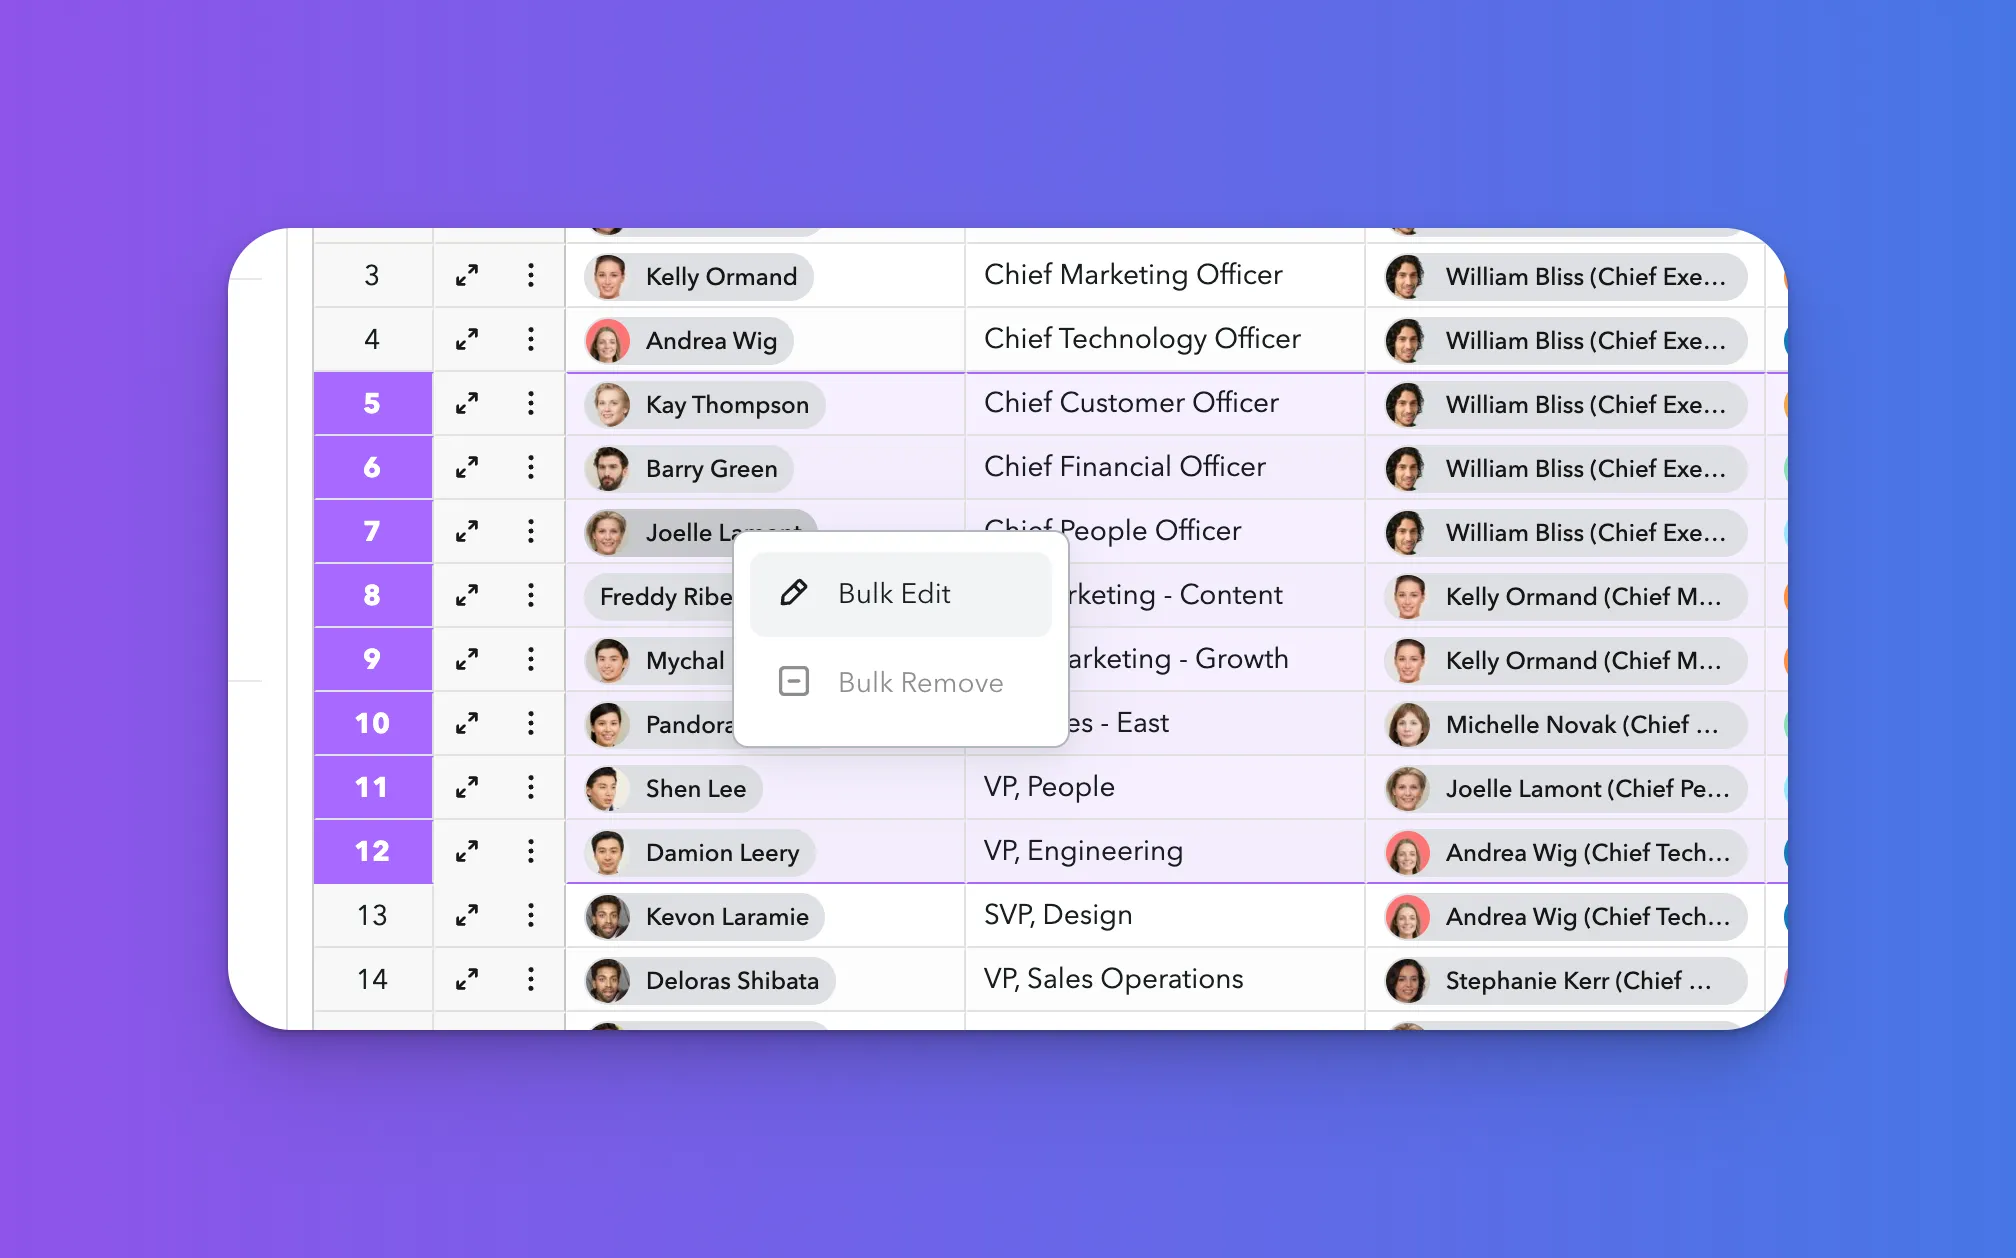
Exporting
Select the Download Icon in the top right corner of the data sheet to bring up the export options:
Copy all data & headers
This option will copy the entire data sheet to clipboard including headers.
This data can then be pasted into a spreadsheet or another system.
Note: this is not recommended for very large data sets.
Export to CSV
Download a CSV of the data. You will be presented with a few options for what format the data can come in.
Syncing Data
ChartHop data sheets can be live synced to a spreadsheet or excel file. See more at Managing data sheet and calendar syncsManaging data sheet and calendar syncs
Modules: HRIS | Engagement | Goals | Performance | Compensation Reviews | Headcount Planning