
Compensation Export
Use the Compensation Export page to pull a full history of compensation changes for your organization into one table and export it to CSV. Unlike the data sheet, this page shows one row per compensation change, so an employee with several raises appears on several rows. It's built for historical compensation reporting: for example, an audit or a data request that needs every base, variable, and total pay change over a period.
This page is not accessible to all employees. Access is governed by the same permission as the Org Changes History page. If you can't see it, ask your ChartHop administrator.
Finding the page
In the left sidebar, open People Ops Tools, then select Compensation Export. It sits just below Payroll Export.
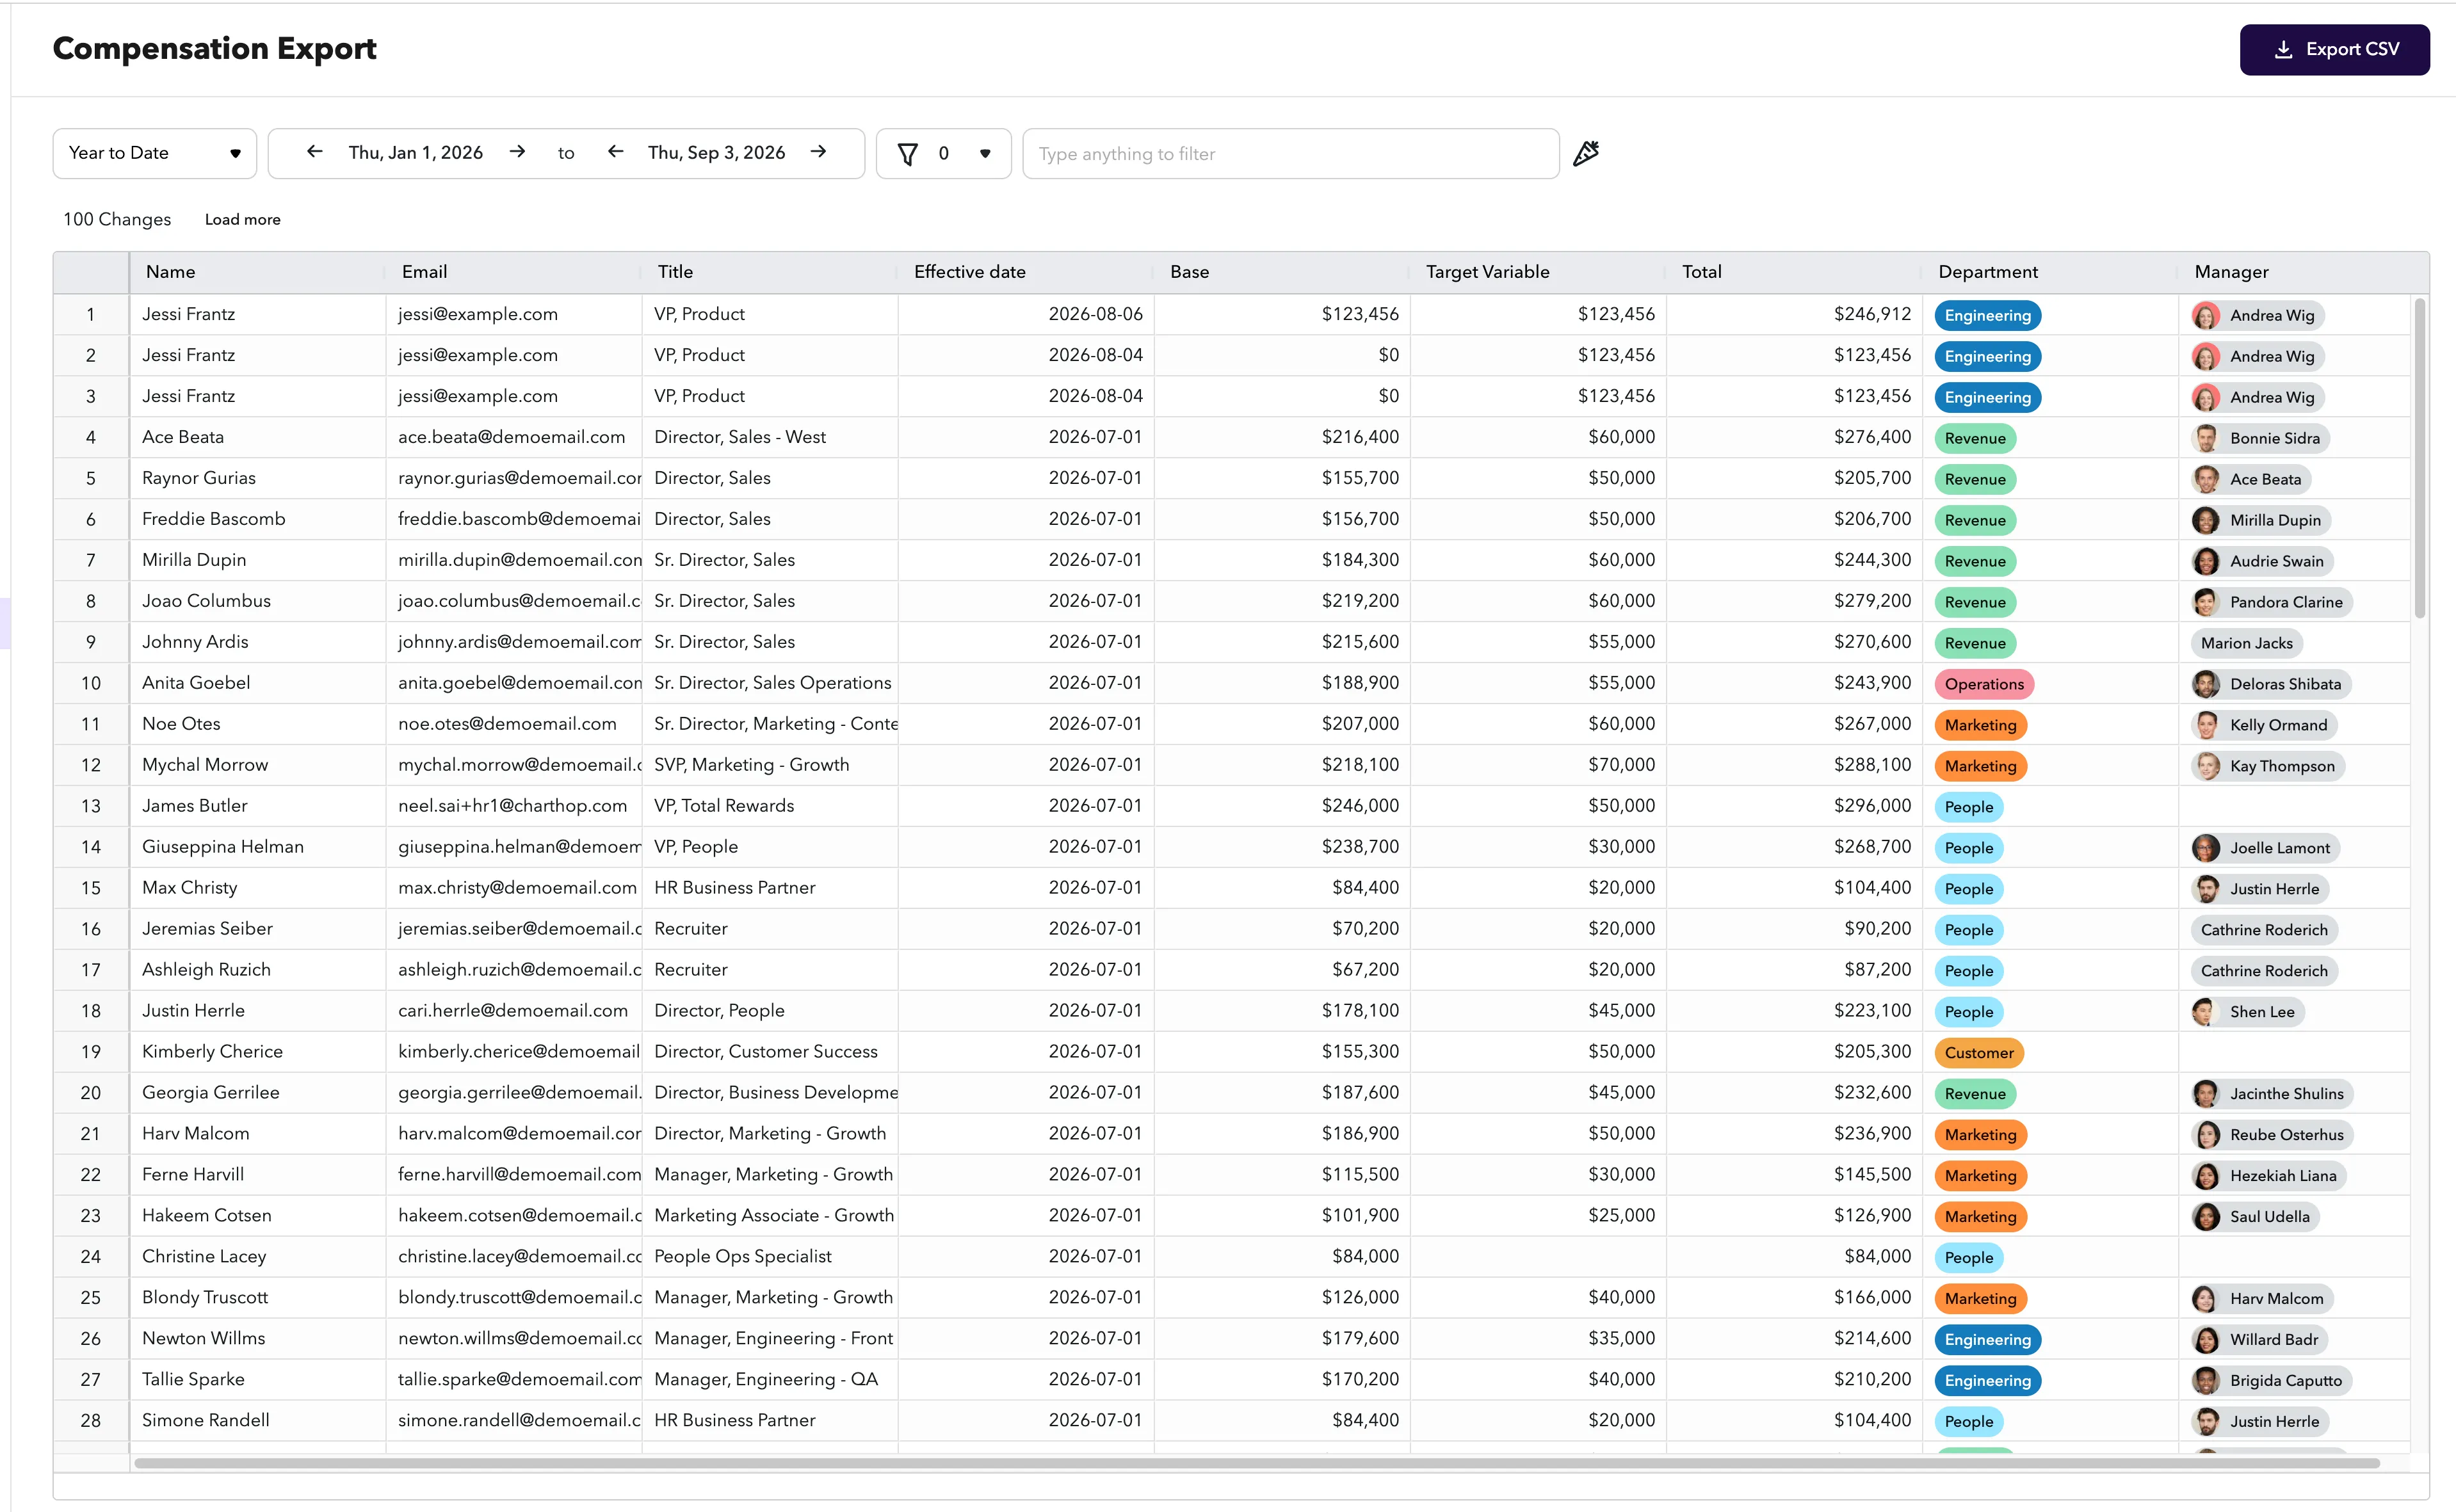
What the table shows
Each row is a single compensation change for one employee, as of its effective date. The default columns are:
Column | Description |
|---|---|
Name | The employee |
The employee's work email | |
Title | Job title at the time of the change |
Effective date | The date the compensation change took effect |
Base | Annualized base pay |
Target Variable | Annualized target variable pay |
Total | Base plus Target Variable (shown when both use the same currency) |
Department | Department at the time of the change |
Manager | Manager at the time of the change |
The count above the table (for example, "42 Changes") shows how many rows match your current date range and filter. Results load 100 at a time; select Load more to load the next set.
Filtering the results
Two controls at the top of the page narrow what appears in the table (and what gets exported):
- Date range: set the start and end dates to bound which compensation changes are included by their effective date. The range defaults to the start of the current year through today.
- Filter bar: type to filter the rows (for example, by name, department, or manager).
Exporting to CSV
- Set the date range and filter so the table shows the changes you want.
- Select Export CSV in the top-right corner.
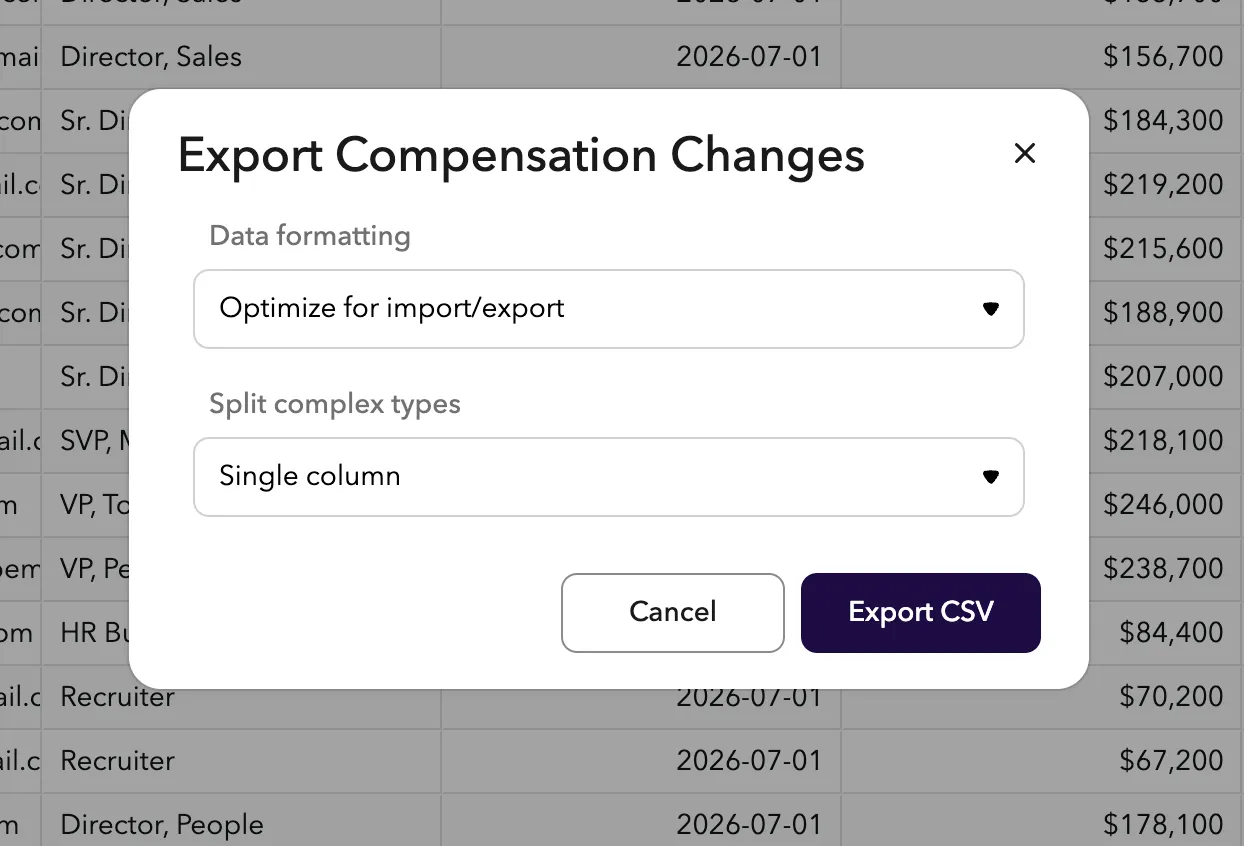
- In the Export Compensation Changes dialog, choose your options:
- Data formatting: Optimize for readability uses field names as headers and formats values for people, while Optimize for import/export uses field codes as headers and formats values for computers.
- Split complex types: splits complex fields into separate columns.
- Select Export CSV. ChartHop builds the export in the background.
- When it's ready, select Download Export to save the CSV.
The export uses the same date range and filter that are applied to the table. Set those before exporting.
Modules: HRIS | Engagement | Goals | Performance | Compensation Reviews | Headcount Planning